Composting of EFB and POME: Operational Records Compared to Existing Literature
By Michel Buron,¹ * Matthieu Frappé,¹ Rodrigo Erales² and Jorge Mario Corzo Rivera²
June 2013
- Kyoto Energy Pte Ltd, Singapore, * Corresponding Author
- Inversiones de Desarrollo SA (NDESA), 01019 Guatemala City, Guatemala
→ See also:
Experience was drawn from the implementation and monitoring of a co-composting of EFB and POME registered as a CDM project activity. The project was designed based on the literature existing at that time and significant discrepancies were observed after the optimization of the composting process. This paper provides insights on the performance of the project in terms of emission reductions (CDM aspects), substitution rate of chemical fertilizer achieved (composting process), and discusses the observed discrepancies with literature values. In comparison to the results of 2002 fromSchuchardt et al., more abundant rainfall showed to significantly slow down the composting process, lengthening the active period phase to 20 weeks. Comparable ratios of POME per EFB were however observed. In terms of inorganic fertilizer substitution, 7.18 dry tons of the produced compost could theoretically substitute a ton of inorganic fertilizer blend with a comparable balance of N P K Mg. In case only compost is applied, 17.3 dry tons of compost would be needed to satisfy or exceed these nutrients needs for a plantation in peninsular Malaysia.
Keywords: Co-Composting, EFB, POME, Compost nutrients, CDM
Introduction
Composting has been hailed for long as a truly green and sustainable practice, turning wastes into valuable product, able to offset chemical additives right where waste were produced in the first place. Co-composting of agricultural residues with waste water goes even further in this way and stirred strong enthusiasm among growers and green project developers alike. However little was known about the actual process parameters of these novel composting combinations and only few reference study papers arose to fill this gap. As regards the co-composting of palm oil empty fruit bunch (EFB) and palm oil mill effluent (POME), the reference paper has been mostly that of Frank Schuchardt based implementations in Indonesia (Schuchardt, etal., 2002) and (Darnoko, et al., 2003).
This paper aims at validating results or discussing discrepancies observed between this literature and a reference co-composting plant in Guatemala. Inorganic fertilizer displacement will also be described, and key information will be provided regarding the performances as greenhouse gas reduction project.
1 Literature VS Implementation
1.1 Materials and Method
Put in simple terms, the process of co-composting consists in piling EFB into windrows, and to pour POME onto it so as to maintain optimal moisture conditions for the decomposition reaction. Aeration is ensured by the porous nature of the material itself (Suhaimi, et al., 2001), and improved by mechanical turning equipments. The windrows were built up by EFB piling the one after the other, within an average of 4 days. This building period is considered short enough to guarantee a homogeneous evolution of the composting material within a given windrow. POME was added daily during the 10 first weeks of composting. The windrow moisture was kept relatively stable around 70%. The windrows are left in open air but water tight sheets were laid over them during rain.
| Composting Period | Inputs and Actions |
| Day 1 to 4 | EFB and POME inputs, turnings |
| Week 1 to 10 | POME inputs only, turnings |
| Week 11 to 20 | Curing period: no inputs, turnings |
The existing literature is discussed in comparison to an EFB/POME co-composting site located in the province of Izabal, Guatemala. In 2009 the average air temperature at the site ranged from 16.1 to 28.7°C, with a yearly average of 23.1°C. The annual rainfall has been up to 3,600 mm. In comparison to this, the weather at the Indonesian site of the discussed literature source was warmer by 5-6°C, and less rainy by 1,600 mm in annual rainfall. (Schuchardt, et al.,2002).
In the reference co-composting implementation site, a large number of measurements were taken over a whole calendar year, providing a basis for statistical considerations. Over the one year period of operation, between July 2009 until July 2010, 87 windrows were built, and more than 2,700 and 2,800 events of POME and EFB additions respectively were recorded. Temperature measurements were taken 3 to 4 times a week over the whole windrow lifetime.
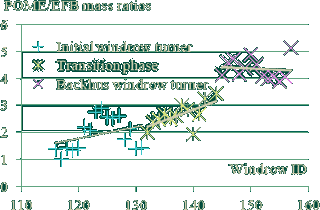
The measurements were performed according to predetermined and unchanged procedures in order to maximize the consistency of records. The measurement samples were split into several groups when significant context variations occurred. (e.g. Figure 1).
1.2 Ratio of POME over EFB
The literature announced an optimum of 3.2 m³ POME ton EFB-1, and a maximum of 5.3 m³ POME ton EFB-1 (Schuchardt, et al., 2002).
Figure 1 gives the POME/EFB ratio over the entire lifetime of each windrow of the reference project implementation. These ratios of inputs correspond to a balance of moisture in the composting material. POME has been added until the composting material showed average moisture of 70%.
Windrows were attributed unique IDs at the time of their creation. These IDs can therefore give a chronological indication of the order in which the measurements are to be considered.
The turning of the windrows was firstly performed by a straw turner mounted on a tractor. The combination could achieve 2 to 3 turning of windrows per week. The aeration frequency could be improved by the introduction of dedicated windrow turner resulting in daily turning of the windrows. The impact on the POME/EFB mass ratio can be seen before and after the introduction of this equipment. The sample population was split in three parts, respectively before, during and after the introduction of the dedicated windrow turner. Linear regression curves were added to give statistical consolidations.
It was observed that this value widely depends on the turning frequency applied. The rising trend which can be particularly noticed in the second population is due to the fact that an increasing fraction of lifetime of the windrows was benefiting of the operation of the new windrow turner.
The initial ratio was located around 2 m³ POME ton EFB-1, whereas the introduction of the windrow turner raised this ratio to 4.4 m³ POME ton EFB-1. This is reasonably in line with the above-mentioned literature result, which is based on a project using also a dedicated windrow turner.
1.3 Compost Temperature
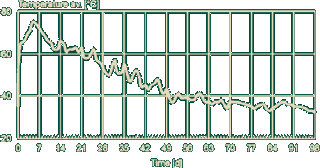
The composting models draw a distinction between an active composting phase, characterized by high temperatures as a result of the decay activity, and a curing phase of lower decay activity, with a temperature gradually decreasing down to the ambient level.
As illustrated by Figure 2, Schuchardt provided results in this sense and showed a curing period reached after 10 weeks, with a temperature peak around 75°C during the first week. (Schuchardt, etal., 2002)
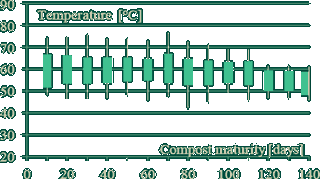
Figure 3 gives the statistical temperature spread by windrow maturity, expressed in days from the date of windrow creation. For each maturity group, the maximum and minimum values are shown (vertical line), as well as the spread by ±1 standard deviation (vertical grey box).
Besides the wide data spread, it can be observed that signs of steady temperature decrease are only visible after the 10th week of composting, which leads to think that the active period lasted longer than in the above mentioned literature. After 20 weeks, the average windrow temperature has not yet reached the ambient temperature. This indicates a longer active period caused by slower composting. The slow composting could be explained by the high moisture level slowing down the air circulation through the thickened material, hence causing a heterogeneous temperature distribution with a particularly hot core. These high temperatures (often above 70°C) are no longer favorable for thermophilic bacteria, which is then self-hindered in its composting activity.
On average, the temperatures at the early composting stage are also lower than those presented by Schuchardt. This could be explained by the slow-down of the composting intensity, causing a dilution the heat release from the decomposition process over more than 20 weeks instead of 10 weeks.
1.4 Ratio of Carbon over Nitrogen
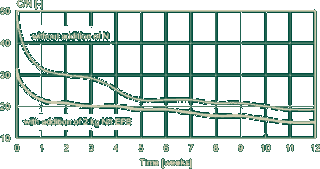
The composting process implies the aerobic decay of organic material. This reaction results in release of carbon dioxide (CO2) and water vapour, and practically no methane as it would happen in an anaerobic decay. Since carbon is released the ratio of carbon over nitrogen (C/N) in the compost tends to decrease.
Darnoko reported a reduction of this ratio from 50 to 15. (Darnoko, et al., 2003) Figure 4 provides the evolution curve over 12 weeks of composting, with and without addition of nitrogen to the windrow.
After a fast decrease, the ratio reduction slows down to reach 20 after 10 weeks without nitrogen addition.
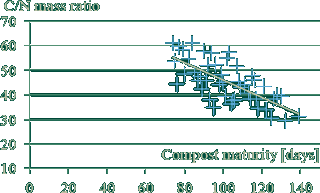
Figure 5 gives the C/N measurements carried out on the compost close to maturity, from week 10 until week 20. A linear trend line provides a data consolidation.
A clear decreasing trend can be observed, from 60 down to 30, which indicate that the active period is still continuing until the 20th week. The high ratios found even after 10 weeks of composting show the slow activity obtained in the considered site, in comparison to the results from Schuchardt (Schuchardt, et al., 2002).
It seems however unrealistic to linearly extrapolate the decrease rate for the compost below 10 weeks of maturity, as C/N ratios would nearly reach 80. That leads to suppose that the C/N ratio underwent little variation during the first 10 weeks of composting, despite the composting activity shown by the high temperatures in Figure 3. The POME inputs during these 10 first weeks could have partly compensated for the carbon loss by bringing fresh organic matter to windrows.
| Component | Value | Unit | Standard Deviation |
| N | 15.6 | [kg/t DM] | 2% |
| P (in P2O 5) | 3.2 | [kg/t DM] | 4% |
| K (in K2O) | 14.1 | [kg/t DM] | 5% |
| Mg (in MgO) | 5.4 | [kg/t DM] | 4% |
2 Substitution of Inorganic Fertilizers
The content of nutrients in the produced compost was tested at various stages of the curing period (week 11 to 20). Measurements were performed by the accredited laboratory Soluciones Analiticas SA. The focus was given to nitrogen, phosphorus, potassium and magnesium. Table 2 provides the nutrient content per ton of dry compost, and the statistical spread of the 162 measurements.
| Nutrients | Compost Balance |
Recommended Nutrient | |
| Balance | Mass | ||
| N | 41% | 28% | 120.0 |
| P | 8% | 4% | 16.1 |
| K | 37% | 68% | 285.6 |
| Mg | 14% | 0% | 0 |
The records have shown no particular trend with the increasing maturity of the compost, remaining stable over the 10 weeks of the curing period.
Tarmizi and Mohd Tayeb studied the optimal nutrient supply for a mature palm oil plantations in Malaysia. (Tarmizi, et al., 2006) The nutrients of this compost are present in proportions which approximately match the recommended ratios. Table 3 underlines the comparison between the two sets of ratios. The produced compost mostly lacks of potassium. This comparison is valid only in the context of plantations in peninsular Malaysia, or regions with comparable soils.
For the purpose of determining the substitution of inorganic fertilizers, a comparison can be drawn with a fertilizer mix of equivalent nutrient ratios. Table 4 lists out typical inorganic fertilizers with their mass content of nutrient in elemental form.
| Name | Formula | Mass Content |
| Ammoniumsulphate | (NH4) 2SO4 | 21.2% of N |
| Superphosphate | Ca (H2PO4) 2 | 26.5% of P |
| Muriateofpotash | KCl | 52.4% of K |
| Kieserite | MgSO4 | 20.2%of Mg |
A comparable nutrient balance can be obtained with a blend of the four above inorganic fertilizers in the mass ratios of 53%, 9%, 19% and 19% respectively. This blend would have the same nutrient amount as 7.18 tons of dry compost. If expressed in terms of wet mass with compost moisture of 30%, the displacement ratio rises up to 10.25 wet tons per ton of inorganic fertilizer blend.
The weakness of this comparison is that the considered inorganic fertilizer blend is not what would have been applied to the palm plantation, because it does not match the recommended nutrient balance. In other words, the compost would still need additional inorganic fertilizer in order to rectify the nutrient ratios as per the recommended balance. (As per Table 3)
Another consideration can be the comparison between the inorganic fertilizer blend actually applied against the amount of compost that would satisfy or exceed all the nutrient needs of the palm plantation without inorganic fertilizer addition. This second comparison yields 17.3 tons of dry compost per ton of fertilizer actual blend. This corresponds to 24.7 tons of compost at 30% moisture.
3 CDM Aspects
3.1 Project Features
The reference site is a Clean Development Mechanism (CDM) defined under the United Nation Framework Convention on Climate Change. CDM is one of the three flexible mechanisms enabled by the Kyoto Protocol, aiming at reducing green house gas emissions. The project was registered on the 18th July 2009, start of the monitoring of its performance.
The monitoring of such project covers the amounts of composted material (EFB and POME) in term of mass and quality (COD content of POME). EFB and compost transportations must be recorded in order to show the relative impact on truck fuel consumption between the project activity and the scenario that would have happened otherwise. Usually this composting project reduces the overall transportation stream; hence typically no project emission is accounted for this aspect.
Finally, the composting process must be monitored to show that it occurs under aerobic conditions. This CDM requirement still has few guidelines, which has left the project developer to determine what parameter will be relevant for this assessment, and which values are to be reached. Given the limited literature sources and the sensitivity of the composting parameters to the local conditions, this monitoring element is one of the main challenges faced by CDM developers in composting.
3.2 Emission Reductions
| Item | Value | Unit |
| EFB wet mass | 17,706 | tonEFB |
| POME mass | 43,004 | ton POME |
| COD of POME | 62,981 | mg l-1 |
| Run-off water mass | 11,421 | ton |
| COD of Run-off water | 12,876 | mg l-1 |
| Compost wet mass | 15,880 | ton |
| Total ER claim | 13,396 | ton CO2e |
| - ER from EFB | 1,357 | ton CO2e |
| - ER from POME | 12,154 | ton CO2e |
| ER per ton of initial FFB | 0.16 | ton CO2e ton FFB-1 |
The key values for the first monitoring period, stretching from 18th July 2009 until 31th July 2010, are provided in Table 5.
The emission reduction is realized by the avoidance of the methane emissions that would have occurred during the anaerobic decay of POME and EFB in the absence of the project activity, provided that this alternative scenario can be proved. Although ERs are performed by methane avoidance, the values are expressed in tons of CO2 equivalent, which is the standard unit for green house gas. This is based on the observation that 1 ton of methane has a global warming effect comparable to 21 tons of CO2. This equivalence ratio of global warming potentials was determined by the Intergovernmental Panel on Climate Change. (IPCC, 2006)
The last line of Table 5 gives a holistic indication of the project ability to convert a palm oil mill fresh fruit bunch (FFB) throughput into tradable ERs. The same ratio was determined for a project of biogas capture and utilization in another Guatemalan palm oil mill. In this other project, POME is treated in bio-digesters and the collected biogas fuels gensets, with excess biogas being flared. Over its first year of operation, this project featured a ratio of 0.34 ton CO2e ton FFB-1. This value may appear much larger than the 0.16 ton CO2e ton FFB-1 of the considered co-composting activity.
3.3 Sustainability Benefits
The co-composting of EFB and POME offers many advantages as regards each aspect of the sustainability. (KYOTOenergy, 2007)
On the environmental side, the water and oil quality is preserved by the reduction of the final POME discharge into rivers or plantation. The displacement of chemical fertilizers by organic compost also offers a softer fertilization option, and avoids the risk of eutrophication of water streams. (Proliferation of aquatic flora due to excessive presence of nitrates)
On the social side, the nuisance of anaerobic pond gaseous releases is avoided, and the water quality protection mentioned above also bear benefits on health of the local people.
Finally, the economic advantages of this type of project are the savings in term of chemical fertilizer purchase, which can also result in avoided imports at national level if it was produced abroad. Employment is generated for the construction and operation of the site, and technology transfer occurs through process and equipments.
4 Conclusions
The parameters of co-composting of POME and EFB showed to be significantly dependent on the implementation environment. Discrepancies were outlined between the reference project and the discussed literature which was based on an Indonesian site with climatic differences compared to the reference implementation.
Longer composting times were observed in section 1.3, up to 20 weeks, possibly owing to the cooler and rainier climate. The active period was determined as both longer and lower in intensity. A significant delay was found in the decrease of the C/N ratio, mostly occurring between week 11 and 20 when the POME inputs are over. The causes of this delay are still unclear and C/N ratio measurements would be needed during the 10 first weeks to have the evolution curve over the whole windrow lifetime.
In term of process feasibility, it was confirmed that forced aeration is not needed to achieve a complete composting, but highly benefits from mechanical windrow turning equipments, in line with M. Suhaimi. (Suhaimi, et al., 2001)
Regarding inorganic fertilizer substitution, 7.18 dry tons of the produced compost could theoretically substitute a ton of inorganic fertilizer blend with a comparable balance of N P K Mg. In case only compost is applied, 17.3 dry tons of compost is needed to satisfy or exceed all nutrients need for a plantation in peninsular Malaysia.
5 Acknowledgments
The authors would like to thank the project owner of the Indesa co-composting site for allowing these results to be made publically available.
6 Bibliography
- Darnoko, Guritno and Schuchardt SIMULTANEOUS UTILIZATION OF FRESH POME AND EFB FOR COMPOST PRODUCTION [Conference] // Porim International Palm Oil Conference. - Kuala Lumpur : [s.n.], 2003.
- IPCC Guidelines for National Greenhouse Gas Inventories [Book]. - Hayama : Institute for Global Environmental Strategies (IGES), 2006. - 4-88788-032-4.
- KYOTOenergy CDM project 2527 : Co-composting of EFB and POME project // Project monitoring, July 2009 to July 2010. - 2010.
- KYOTOenergy Sustainable development and CDM projects in the Palm Oil Industry in Malaysia [Conference] // Porim International Palm Oil Conference. - Kuala Lumpur : [s.n.], 2007.
- Schuchardt, Darnoko and Guritno COMPOSTING OF EMPTY OIL PALM FRUIT BUNCH (EFB) WITH SIMULTANEOUS EVAPOARATION OF OIL MILL WASTE WATER (POME) [Conference] // International Oil Palm Conference. - Nusa Dua, Bali : [s.n.], 2002.
- Suhaimi and Ong COMPOSTING EMPTY FRUIT BUNCHES OF OIL PALM [Journal]. - Kuala Lumpur : Malaysian Agricultural Research and Development Institute, 2001.
- Tarmizi and Tayeb Mohd NUTRIENT DEMANDS OF Tenera OIL PALM PLANTED ON INLAND SOILS OF MALAYSIA [Journal] // Journal of Oil Palm Research. - Kuala Lumpur : Malaysian Palm Oil Board, June 2006. - Vol. 18. - pp. p. 204-209.
***
Copyright © 2013, ECO Services International